13th Molecular and Cellular Cognition Society Meeting

On 13 November 2014, I participated in the 13th Molecular and Cellular Cognition Society (MCCS) Meeting in Washington, D.C.
I helped Prof. Alcino Silva, my co-advisor, with his tutorial on ResearchMaps, a web application that I am developing as part of my dissertation. I also presented a poster on ResearchMaps at this meeting. Click on the image of our poster for a PDF copy.
ResearchMaps is a tool that records and visualizes causal assertions. Consider this causal assertion: A germ line deletion that eliminated the alpha and delta isoforms of CREB led to a decrease in hippocampal memory. To represent this statement in ResearchMaps, a user inputs the details of the experiment that produced this result. ResearchMaps then infers the excitatory relationship between CREB and hippocampal memory, and visualizes this relationship.
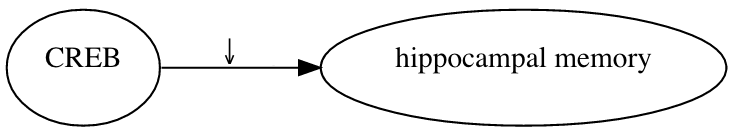
In this picture, the large, pointed arrowhead symbolizes an excitatory relationship. The smaller, downward-pointing arrow indicates that the experiment involved a negative manipulation of CREB. The research maps of multiple experiments can be combined, yielding much more elaborate maps.
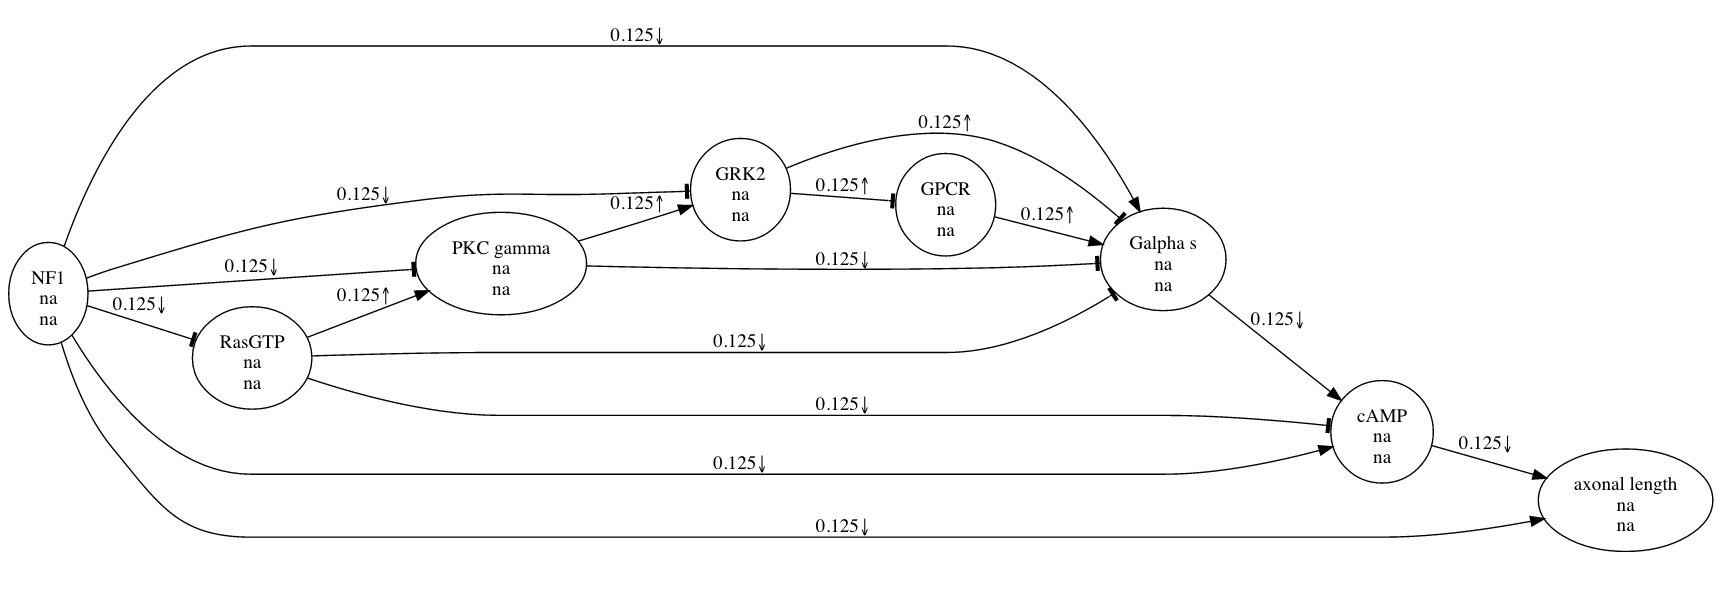
These compact representations of causal assertions help scientists to analyze results and plan experiments. Although a scientist might still choose to retrieve details from the original article, a map can quickly summarize some of the article’s most salient parts: the experimental agents and targets, the experimental manipulations, and the types of causal connections suggested by the results. Having studied our maps, a scientist has a more complete picture with which to plan experiments. For this purpose, the maps not only show which experiments have been performed but also make obvious which experiments have not been performed (or at least which have not been recorded). As we develop ResearchMaps—both the software and its underlying conceptual framework—I suspect that there is great potential to define objective metrics for determining the trajectories of scientific inquiry.
This web application runs on Node.js, creates visualizations with Graphviz, and stores data in Neo4j. We are currently writing a manuscript that will describe the application in full detail. Refer to our poster’s abstract below for more information.
We received a lot of great feedback on ResearchMaps at this MCCS meeting. People’s questions about our software conveyed what needs to be more clear—both in ResearchMaps’s user interface and in our descriptions of it. I noticed that a lot of the requested features resembled those that you often see on major websites. One example was the request for Wikipedia-like user moderation of the maps. Our team will act on a lot of this feedback as we prepare our manuscript for submission.
Abstract
Although causal assertions are the very fabric of neuroscience, including molecular and cellular cognition (MCC), there are currently no tools to help researchers keep track of the increasingly complex network of causal connections derived from published findings. In MCC, researchers routinely use a cross-disciplinary approach that involves molecular, cellular, systems, behavioral, and cognitive neuroscience approaches. This presents an unprecedented challenge for individual neuroscientists, because they are asked to process and remember a large number of concepts, approaches, and findings from a wide range of very different fields. Keeping track of causal connections among this myriad of concepts is nearly impossible without the aid of specialized tools that simplify this process.
To address this growing problem, we developed a free web application (ResearchMaps) to build interactive maps of causal information derived from research papers. ResearchMaps is a collection of intertwined networks where the identity and properties of biological phenomena (the nodes in the networks) are linked by weighted causal connections (the edges in the networks). These edges represent one of three possible types of causal connections between two phenomena:
- excitatory, where one phenomenon promotes the other;
- inhibitory, where one phenomenon inhibits the other; or
- no-connection, where one phenomenon has no measurable effect on the other.
A score (from 0 to 1) assigned to each edge gives users a measure of the strength and consistency of the evidence represented by each connection between phenomena. Additionally, symbols inform users of the types of experiments represented in each edge. Although there are tens of millions of experiments testing causal connections in biology, they fall into a small number of classes. For example, molecular and cellular biologists commonly use at least four major types of experiments to test a possible causal connection between two entities (A and B):
- Positive Manipulations, where A’s levels or activity are increased;
- Negative Manipulations, where A’s levels or activity are decreased;
- Non-Interventions, whose goal is to track how A co-varies with B; and
- Mediation experiments, designed to determine whether C is part of the mechanism by which A contributes to B.
Biologists use convergency and consistency among these experiments to judge the strength of any causal assertion. Therefore, in ResearchMaps, convergency and consistency among results increase the score assigned to each corresponding edge, while contradictions have the opposite effect. By selecting any one edge in the map, users are directed to the exact research papers and experiments represented by that edge, allowing users to explore and validate how that score was computed.
⁂
Subscribe to my mailing list if you’d like to read more.